ParSeq-XAS How-tos
Pipeline launch and command line options
The ParSeq-XAS pipeline starts by python XAS_start.py.
Hint
Use the key -h to discover the start options. Two particularly useful
options are -p {filename} to load an existing project file and
-v 100 to troubleshoot errors.
Data loading
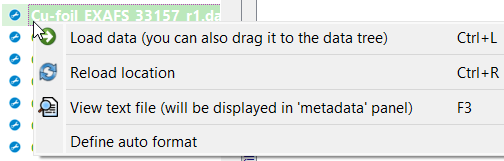 A popup menu over a column file in the file tree.
A popup menu over a column file in the file tree.
Please see the general data format definitions of ParSeq.
Use the button  at the top of the file tree to go to the last used
file location and to use the format definition of that data file.
at the top of the file tree to go to the last used
file location and to use the format definition of that data file.
The content of a column file can be displayed in the ParSeq application in the Metadata splitter. Use the right button popup menu for this command.
If a beamline produces data files with a variable data format that depends on the used instruments, the data format definitions can be automated in ParSeq if the files have a header line with a description of the columns. ParSeq-XAS implements auto_format() methods of a few data nodes (see the module XAS_nodes) that can be tweaked for specific needs.
Data range
The data format widget has a tab “conversion”. Read its tooltip panel. In particular, one can use the function lim(Emin, Emax) in the top-most edit line to select a desirable energy range.
Data deglitching
 A demonstration of glitch removal by scaling.
A demonstration of glitch removal by scaling.
Please see the general data correction capabilities of ParSeq.
Although data corrections can be done in any transformation node, the removal of monochromator glitches is the easiest in the χ(k) node.
Note: When deglitching in the µd(E) node, make sure the pre-edge subtraction and edge normalization are switched off.
Data combinations
In addition to average, sum and rms deviation, ParSeq offers PCA analysis and Target Transformation. Unlike many other implementations of PCA analysis, in ParSeq it is cumulative, signifying that each PCA spectrum has a meaning of the parental spectra. For instance, PCA spectra of a collection of XANES spectra are also a kind of XANES spectra, not just ever decreasing weak oscillatory curves. More description with definitions and examples will be added later.
Project files and data saving
ParSeq-XAS comes with a few example project files located in the saved folder. Use the slider in the preview panel to browse through the project node images:
 Preview in a ParSeq project file.
Preview in a ParSeq project file.
Note
Project files and the involved data files are usually movable to a new location (they are not when on network locations) without losing the reference from the project file to the data.
Note
When saving a project file, pay attention to the current data selection. Only the selected data items will be exported.
Make publication plots
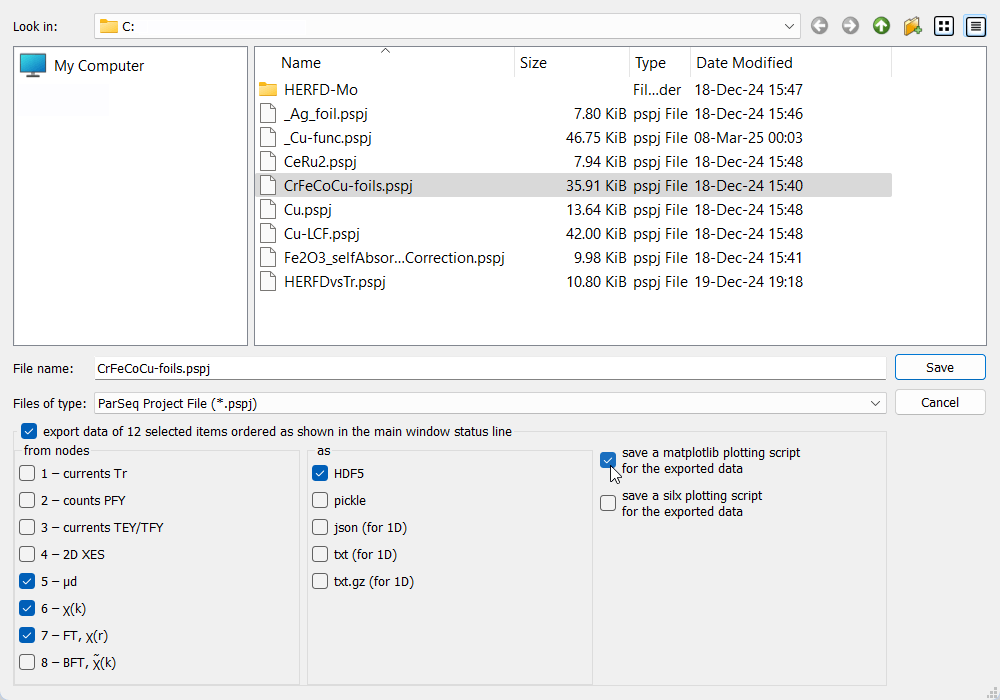 Saving a ParSeq project file.
Saving a ParSeq project file.
ParSeq plot windows (based on silx plots) have a Save button that can export the plot view to a graphics format.
The save project dialog of ParSeq has an option of saving a plotting script together with the involved data. The scripts have a few commented lines that set energy range, custom colors etc. to help the user tweak the plots.
The launch script
XAS_start.pycan be started with the-pkey to load a project file and with the key-nGto run the pipeline with no GUI. The launch script has a short section for this case (no GUI) that does plotting with matplotlib. This section can be adjusted at will.